Editorial
The Great Indian Stock Market Bubble
The Indian stock market has seen SENSEX and NIFTY hit all-time highs despite global economic challenges. This article explores whether the current market conditions indicate a bubble, examining factors like fiscal stimulus, PE ratios, and foreign investments.

On this page
Key takeaways
- The Indian stock market indices SENSEX and NIFTY hit all-time highs in less than a year after the March 2020 crash.
- Governments worldwide implemented fiscal stimulus packages and eased interest rates, leading to increased money flow into economies and stock markets.
- The PE ratio of NIFTY was 42 in March 2021 and remained above 28 in July 2021, significantly higher than its historical median of 20.34.
- India’s Market Capitalization to GDP Ratio reached a 13-year high of 115%, indicating that the stock market is larger than the nation’s GDP.
- Foreign Institutional Investors (FIIs) invested close to Rs 65,000 crores in India in FY21 but have been withdrawing since April 2021, with ~Rs 30,000 crores withdrawn between April and July 2021.
The Indian stock market is in a bubble. Markets crashed frightfully in March 2020 in a matter of days due to Covid-induced lockdowns that were imposed around the world. However, things escalated quickly when SENSEX and NIFTY, the two important benchmark indices, hit their all-time high in less than a year’s time. When one looks around, one finds that many businesses have gone bust, people have lost jobs, and that the COVID-19 pandemic is throwing a tantrum, even in developed nations. Governments across the world have given out fiscal stimulus packages, and interest rates have been eased to get money flowing in the economy.
The stock markets are at a historic high, and something doesn’t feel right about it. A big question arises here: are the stock markets in a bubble? Can there be a crash bigger than last time?
How Did We Get Here?
Firstly, when the lockdown struck in March 2020, we saw a steep fall in markets globally, including India. India had to recover from the economic impact of the COVID-19 pandemic, where we saw businesses suffering, high unemployment, and increased healthcare costs.
The Indian Government and the Reserve Bank Of India (RBI) gave out fiscal and monetary stimulus. Fiscal stimulus is when the government distributes money and resources to the public through moratoriums, loan rebates, and government transfers. Transfer of cash directly to the account of farmers is an example of fiscal stimulus. Monetary stimulus is when the RBI cuts interest rates or buys government bonds from the public. This reduces the cost of borrowing money. A low interest rate on loans encourages the public to borrow money and set up businesses or invest it.
To sum it up, the main aim of the government was to induce cash into the system and encourage economic activity at the same time. The money in the system did go into businesses, but a huge chunk of it went into stock markets as well. Moreover, during the peak of the lockdown, in order to generate income, many retail traders sitting at their homes started investing. More than a crore demat accounts were opened between April 2020 and January 2021.
Huge amounts of money that were pumped into the economy found their way into risky assets like stocks. Additionally, the impact of it can be seen on high inflation rates in the country.
The Price To Earnings Ratio (PE Ratio)
A crucial indicator to know if the stock market is overpriced is the PE Ratio of NIFTY 50. The PE Ratio or Price To Earning Ratio is calculated as the price of the share divided by Earnings Per Share or EPS. EPS is essentially the profit generated by the company divided by outstanding shares of the company. A high PE ratio is a sign of an overpriced share. A low PE ratio is a sign of an undervalued share.
For the 50 companies comprising the NIFTY 50 index, the median PE ratio has been 20.34. Historically, NIFTY crashed or tanked whenever the PE ratio of NIFTY went between 25-28. In March 2021, the PE ratio of NIFTY was 42. That is an insanely large number. In July 2021, the PE ratio of NIFTY was still above 28.
Even though the stock markets are overvalued, if the companies start posting equally good earnings, the valuation of the markets will be justified. A good profit translates to a good EPS for a company. If the EPS increases, the PE ratio automatically starts going down, indicating normalcy.
The Warren Buffet Indicator
The Market Capitalization to GDP Ratio or the Warren Buffet Indicator is another metric that indicates overpriced markets. India’s Market Cap to GDP ratio is at a 13 year high of 115%. This means that the stock market is bigger than the nation’s GDP. In layman’s terms, there is too much investing and trading as compared to too little economic activity. However, in countries like the US, the market cap of listed companies has been almost 1.99 times bigger than the GDP. Yet for a country like India, such a Market Cap to GDP ratio isn’t justified if we compare it to other developing nations.
Foreign Investor Vs Domestic Investors
FII stands for Foreign Institutional Investors. Whereas, DII stands for Domestic Institutional Investors. Foreign Investors do not get sufficient returns by investing in already developed countries like the US, Canada, UK, etc. They instead prefer investing in developing countries like India in hope of a higher return.
After the global markets crashed in March 2020, FIIs turned towards India as an investment opportunity looking at its booming stock market. In FY21, FIIs invested close to Rs 65,000 crores in India. The only time India witnessed FII outflows in FY21 was in April and September. Whenever FIIs withdrew, DIIs would jump in and save the market from falling. The reverse was true as well.
A strong flow of investment from Foreign Investors was a key reason for such high market valuations. FIIs have constantly been withdrawing since April 2021. Between April 2021 and July 2021, FIIs withdrew close to ~Rs 30,000 crores from Indian capital markets.
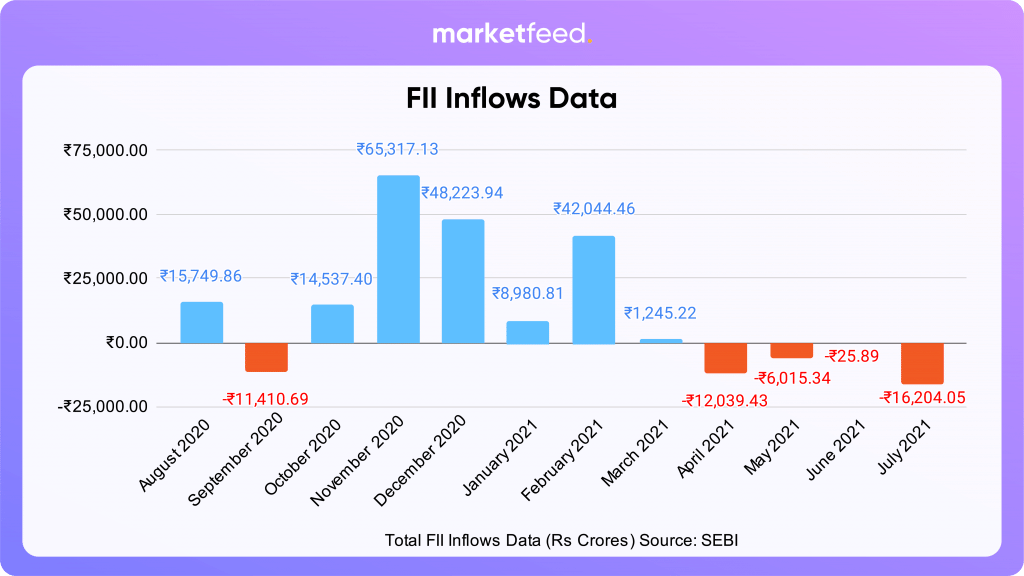
The question is, when are Foreign Investors going to withdraw from Indian Markets? The answer could lie in ‘Taper Tantrum’. To know more about Taper Tantrum, click here.
What Lies Ahead
Another phenomenon is the IPO Boom. In case you haven't noticed, most IPOs that came during the pandemic gave listing gains. Listing gains refer to when the share price jumps up on the first day the shares get listed. This could be because the companies might be deliberately underpricing their IPOs in order to gain investor attention.
Stock markets crash when investors withdraw money suddenly from the markets because of an apparent risk or volatility in the market. The last time investors withdrew money, the lockdown had just been imposed and economic activity had ceased completely.
Inflation rates are high. Globally, governments are looking to increase interest rates in order to curb inflation. Higher interest rates imposed by the Fed in the US or RBI in India can stimulate a market crash. Although, this is just a possibility. One should watch out for changes in policy by global economies.
Do you think we are headed for a market crash anytime soon? You can let us know in the marketfeed app available exclusively for Android and iOS.
Frequently asked questions
What is fiscal stimulus?
Fiscal stimulus is when the government distributes money and resources to the public through moratoriums, loan rebates, and government transfers, such as transferring cash directly to farmers' accounts.
What is monetary stimulus?
Monetary stimulus is when the RBI cuts interest rates or buys government bonds from the public, which reduces the cost of borrowing money and encourages public borrowing and investment.
How is the PE Ratio calculated?
The PE Ratio or Price To Earning Ratio is calculated as the price of the share divided by Earnings Per Share (EPS).
What is the Warren Buffet Indicator?
The Warren Buffet Indicator, also known as the Market Capitalization to GDP Ratio, is a metric that indicates overpriced markets by comparing the total market capitalization of listed companies to the country's GDP.
Written by
Maarg VaidyaRelated reads

Natural Gas Trading: A Beginner’s Guide
Learn the basics of natural gas trading, including liquidity, volatility, derivatives, capital requirements, and factors influencing prices, in this beginner's guide.

Union Budget 2025-26: Key Highlights and New Tax Slabs Explained
Explore key highlights of the Union Budget 2025-26, including new tax slabs, sector allocations for agriculture, healthcare, defense, and infrastructure.

A Simple Guide to Trading Gold and Silver on MCX
Learn to trade gold and silver on MCX with this guide. Understand contract types, capital requirements, and factors influencing prices for profitable trading.
Join 2.4M+ Indians · Free · 2 min